Performance Engineering: 5 Design Decisions That Decide Scale

Most systems do not fall over because the code was wrong. They fall over because a small problem found nothing in its way. A downstream service slows by two hundred milliseconds and a retry storm turns it into an outage. A team adds a hundred and eighty pods and latency gets worse, not better. One enterprise customer lands on a single shard and a healthy cluster starts timing out. The first request after a quiet night takes four seconds while the dashboards still read green. None of these are bugs. They are the predictable behaviour of systems whose conduct under stress was never designed, only assumed.
The engineers who keep systems standing at scale are not writing faster code. They are deciding, in advance, how the system should behave when reality stops matching the happy path. Five patterns carry most of that weight.
Executive Summary: Five Patterns That Decide Performance Under Load
- Circuit Breakers and Rate Limiters. One protects your dependencies, the other protects your entrance. Together they turn cascading failures into controlled, recoverable events.
- Horizontal vs Vertical Scaling. Scale up and scale out are not right and wrong. They are trade-offs in blast radius, consistency, and complexity that you choose, often without noticing.
- Hotspots and Skew. Capacity does not fix imbalance. A cluster at forty percent average utilisation can still have one node at a hundred.
- Cold Start Performance. A service that is fast only when warm is not production-ready, because production traffic arrives exactly when the system is cold.
- The Cost of Context Switching. More threads is not more parallelism. Past a point, the CPU spends its time switching tasks instead of finishing them.
1. Circuit Breakers and Rate Limiters: Turning Cascading Failures into Controlled Events
In any distributed system, everything fails eventually. Networks get flaky, dependencies slow down, and clients behave unpredictably. Without safeguards, a service keeps accepting work it cannot complete, and the backlog amplifies latency, exhausts thread pools, and multiplies retries across the stack. That is how a single slow dependency becomes a company-wide incident.
A circuit breaker monitors calls to a dependency and tracks the failure rate. When failures or timeouts cross a threshold, the circuit opens and stops further calls for a cooldown period, so the system fails fast and returns a fallback instead of blocking on doomed requests. After the cooldown it moves to a half-open state, letting a few trial requests test recovery before closing again. A rate limiter governs how much traffic is admitted in a time window, using strategies such as token bucket, leaky bucket, or a sliding window. It answers one question at the door: should this request be processed at all?
The division of labour is the point:
- Rate limiters protect your service from traffic spikes, abusive clients, and thundering herds at the entrance.
- Circuit breakers protect downstream dependencies and contain the blast radius of a failing one.
- Paired with sensible timeouts and exponential backoff, they enable graceful degradation instead of collapse.
In practice: A payments team scaled hard for a sale but shipped neither pattern, trusting autoscaling to absorb the load. A downstream fraud-check service slowed, requests piled up, threads blocked, and retries compounded. Autoscaling then added pods, each making the same failing calls, which deepened the outage and drove the cloud bill up with it. The fix was not compute. It was a circuit breaker to fail fast on the fraud check and a rate limiter at ingress to smooth the inflow.
Circuit breakers and rate limiters are not defensive coding. They are architectural intent, an explicit statement of how the system behaves when the happy path disappears.
2. Horizontal vs Vertical Scaling: The Real Trade-offs Behind Scale Up and Scale Out
Every growing system eventually asks the same question: bigger machine, or more machines? Scaling decisions are architecture decisions wearing an operations costume, and the common mistake is scaling the wrong tier, adding application pods when the database is the bottleneck, or upgrading the database box when the real problem is unbounded fan-out.
Vertical scaling means making one node bigger: more CPU, memory, and faster disk. It is simple, keeps strong consistency easy because a single node enforces constraints without distributed consensus, and suits stateful workloads. Its limits are hard ones. There is always a biggest box, a single node carries a large blast radius, and doubling CPU rarely doubles throughput when you are bound by locks or a single hot thread. Horizontal scaling means adding nodes and distributing load. It buys elasticity, fault tolerance, and the economics of commodity hardware, but it makes data the boss. Sharding, partition keys, idempotency, and replication lag become core logic rather than afterthoughts.
A practical lens holds up well:
- Stateless compute scales out cleanly, because any node can serve any request.
- Stateful data often prefers vertical first, then careful horizontal scaling through read replicas, partitioning, or consistent hashing.
- You cannot scale the stateless tier beyond the limits of the stateful tier beneath it.
A common production failure: A retail checkout system hit a festival spike and the team scaled the API from twenty pods to two hundred. CPU looked healthy, yet latency exploded. Each checkout made synchronous reads and writes against a single primary database, with row-level contention on inventory and order counters. More pods simply meant more concurrent lock fights. The durable fix was structural: real partition keys, idempotent order creation, asynchronous reservation through a queue, and read replicas for non-critical reads.
Vertical scaling buys time and simplicity. Horizontal scaling buys elasticity and resilience. The real skill is knowing what in your design cannot scale out, and fixing that before you add nodes.
3. Hotspots and Skew in Distributed Systems: When Uneven Load Distribution Breaks Scale
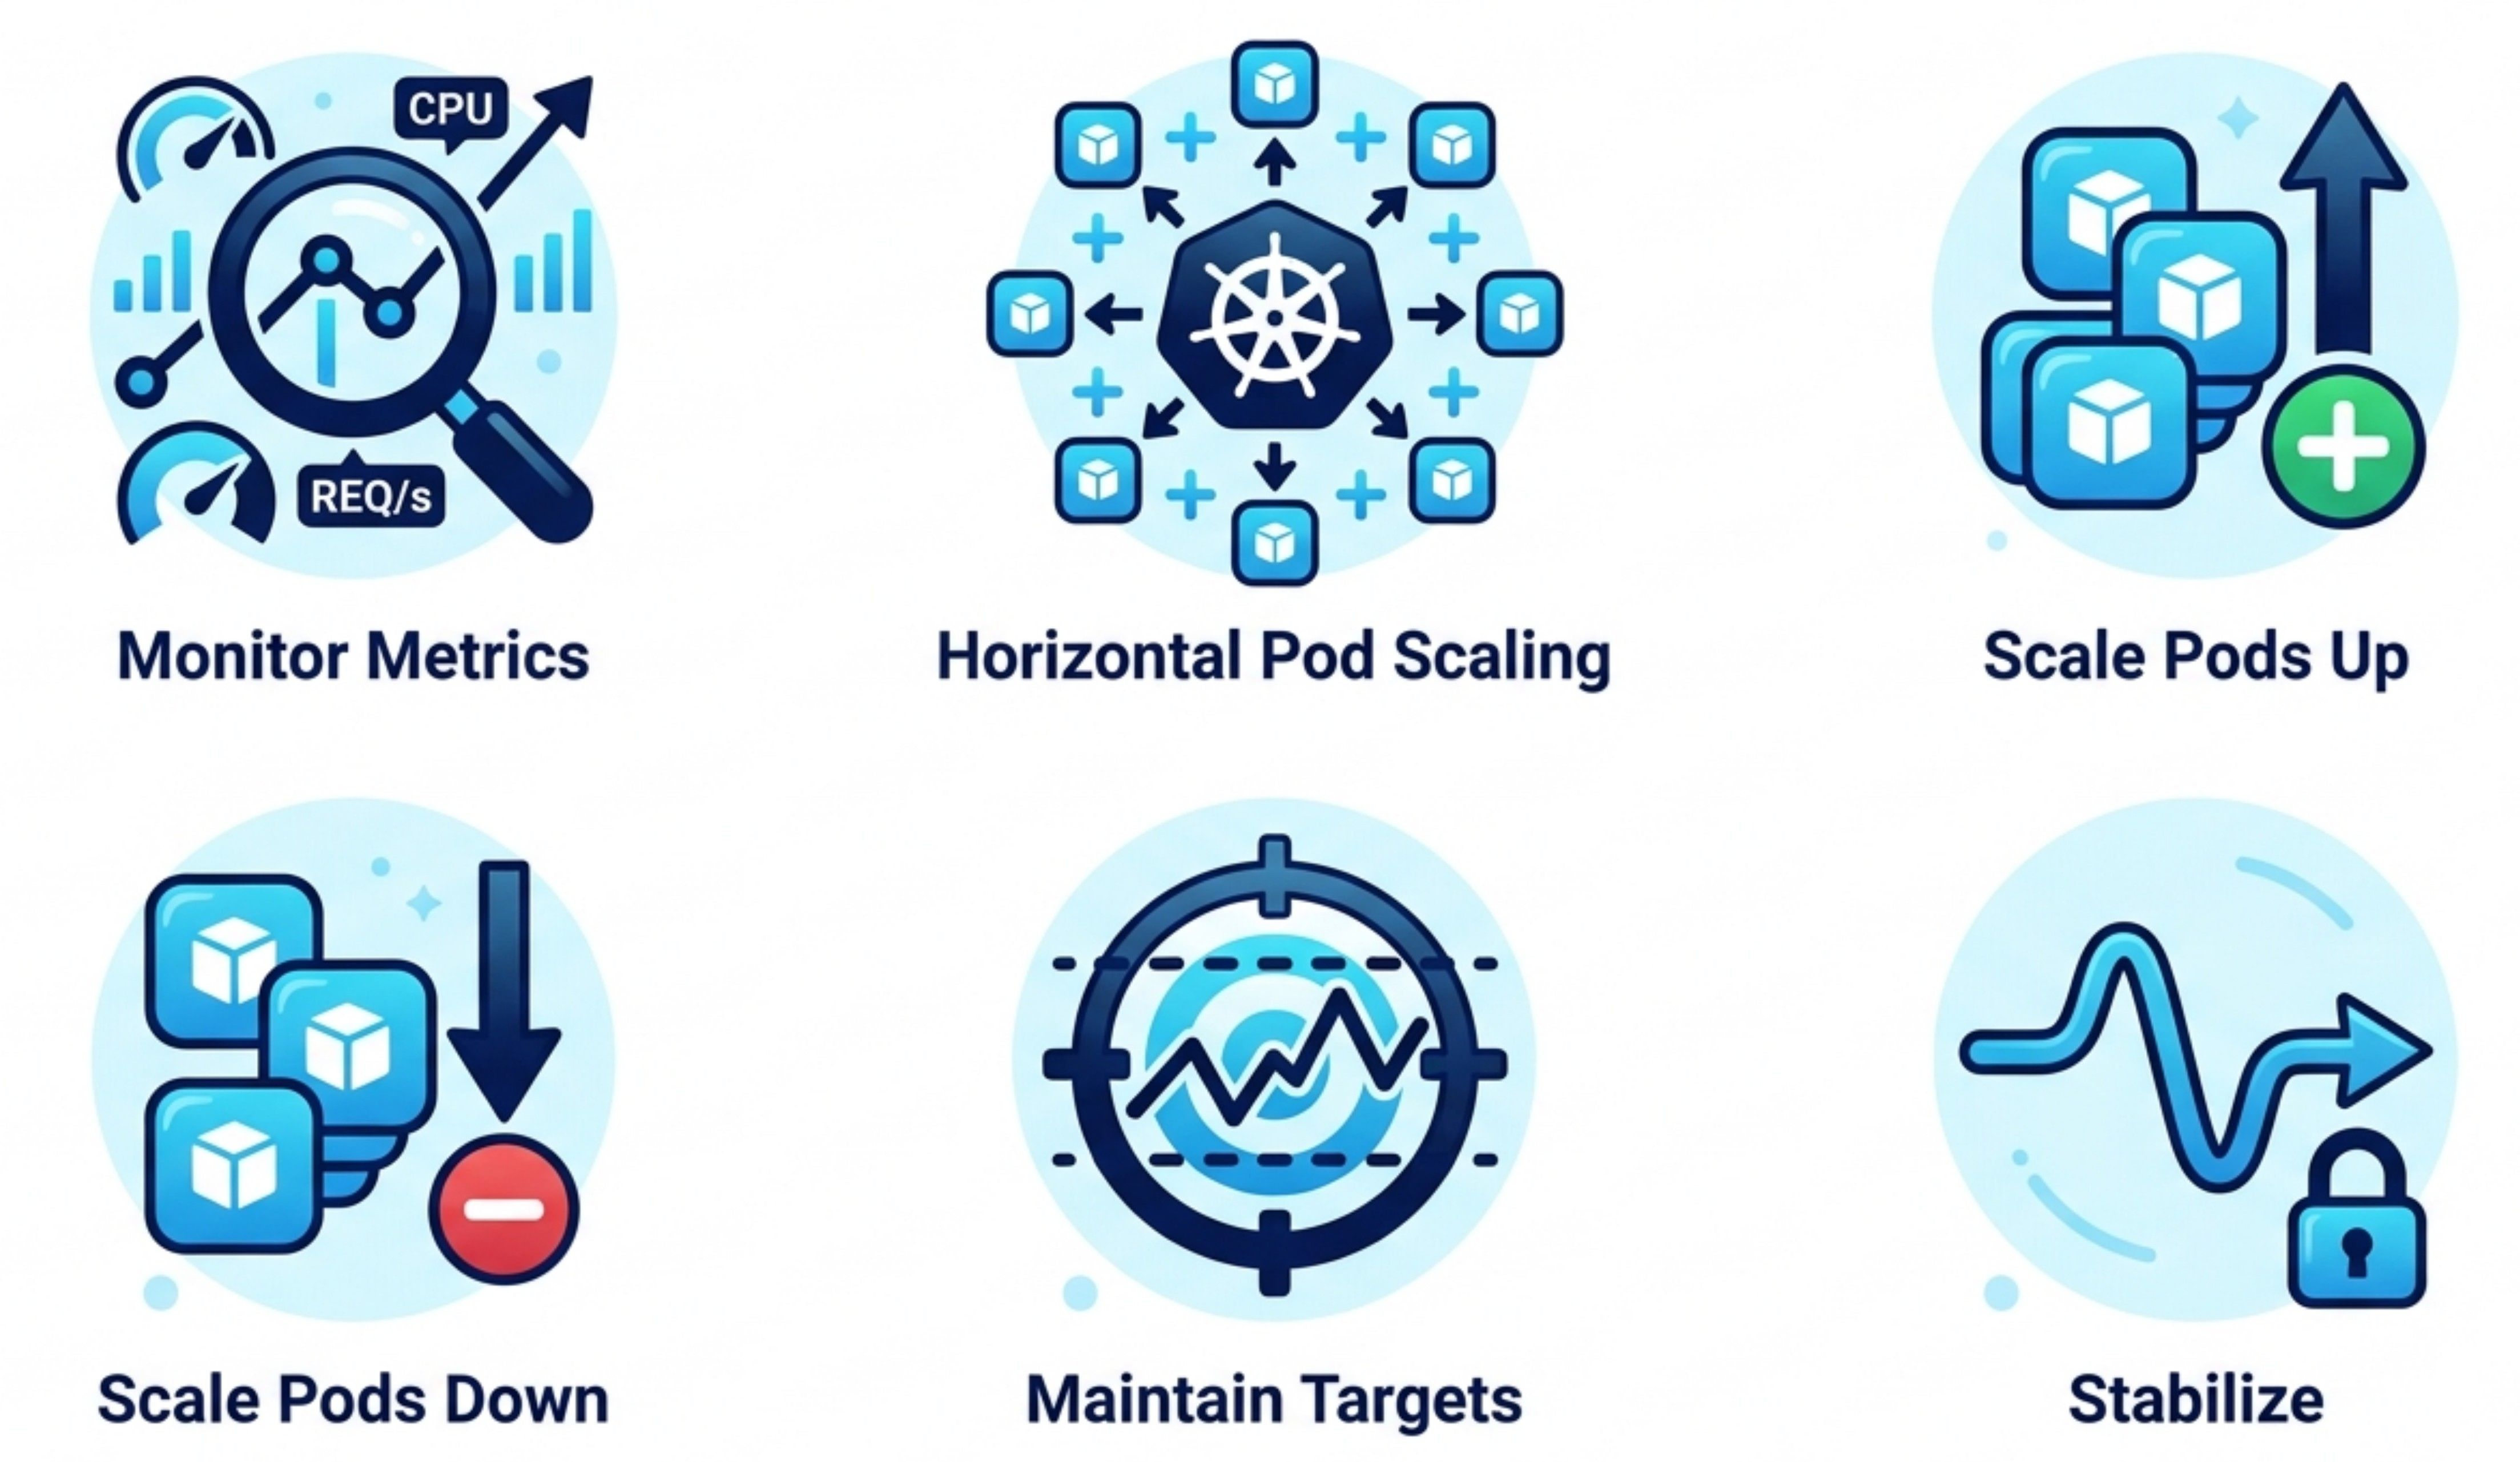
Distributed systems promise that capacity grows with the number of machines. In practice, many fail not from insufficient capacity but from uneven load distribution. Some nodes sit idle while others melt, and the danger is that the system looks healthy on average. Metrics can show forty percent cluster utilisation while one shard is pinned at a hundred.
A hotspot is a node, partition, or shard that receives a disproportionate share of traffic. Skew is the uneven distribution that produces it, and it almost always emerges from data access patterns rather than infrastructure limits. A partition key on user_id concentrates load when one account is enormous. Range-based partitioning on sequential keys such as timestamps pushes every new write to the same node. Temporal skew sends a flash sale or a viral item at a single shard. And real traffic follows a popularity distribution closer to Zipf's law than to anything uniform.
The countermeasures are deliberate, not automatic:
- Hash-based partitioning to spread keys evenly across the cluster.
- Key salting to break a single hot key into many.
- Adaptive load balancing and automatic shard splitting when a hotspot appears.
Where this breaks: A streaming platform stored sessions in a key-value store partitioned by user_id. It worked until a large enterprise customer onboarded thousands of users behind one shared account. Nearly every session write now targeted the same partition. That shard saturated, queues grew, and session timeouts spread across the system. Adding database nodes changed nothing, because capacity does not cure imbalance. Key salting, spreading that account across many partitions, dissolved the hotspot overnight.
A distributed system scales only when work distribution scales with it. Imbalance is not a rare edge case. It is the default shape of real-world traffic, and it has to be designed for from the start.
4. Designing for Cold Start Performance: Making the First Request as Fast as the Thousandth
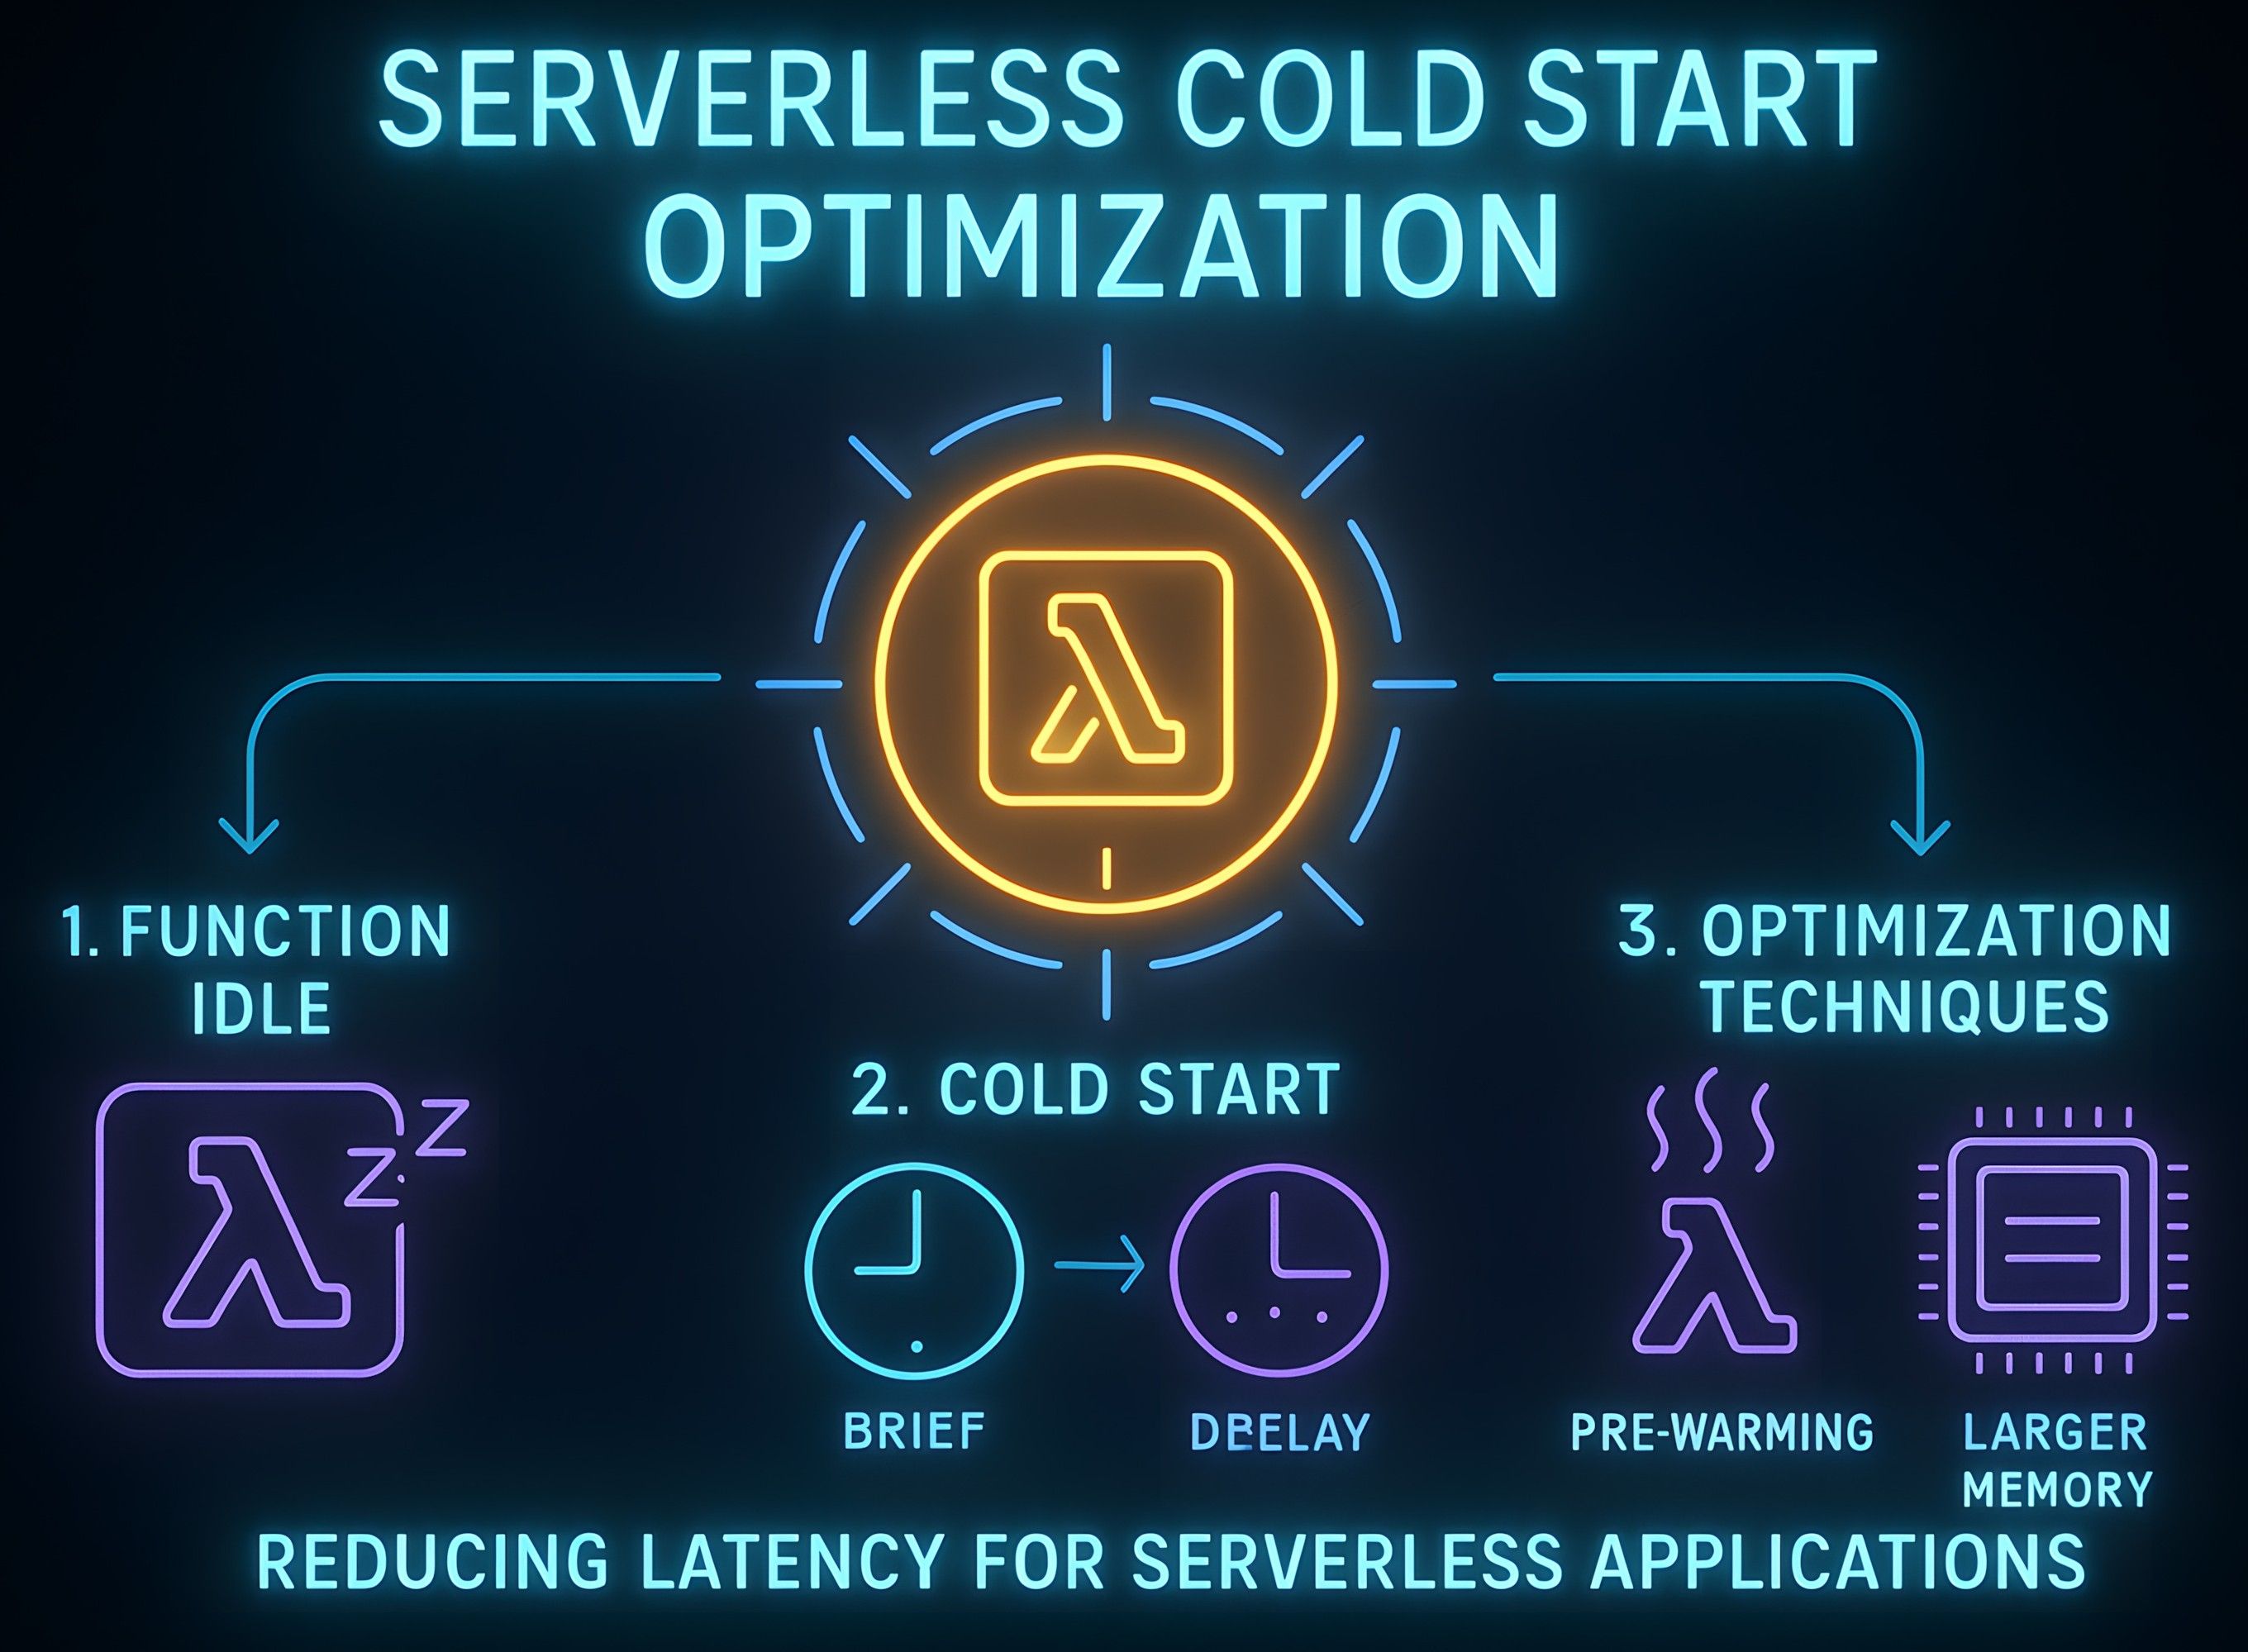
Most performance testing measures warm systems. The service is already running, connections are open, caches are populated, and the runtime has settled. Production traffic is rarely that polite. A service restarts after a deploy, scales from zero during a spike, or wakes after hours of inactivity, and if its cold path is slow, users feel that latency at exactly the moment the system is under pressure. That makes cold start performance a reliability concern, not an optimisation detail.
Cold start is the time a component takes to become ready to do useful work after being idle, restarted, or newly provisioned. Four things usually contribute. Application initialisation covers framework boot, dependency injection, configuration loading, and just-in-time warm-up. Dependency readiness covers database connections, secrets, certificates, and feature flags, each of which costs the first request if loaded lazily. Cache warm-up matters because a service that is fast only thanks to a hot cache will hammer the database directly until that cache fills. Infrastructure startup covers image pulls, health checks, service discovery, and sidecar init.
Designing for it means making startup intentional:
- Keep boot paths lean and preload only what readiness truly requires.
- Separate liveness from readiness so traffic arrives only when the node can serve it.
- Measure time-to-first-successful-request, not just warm average latency, and keep a minimum running capacity or provisioned concurrency for critical paths rather than scaling all the way to zero.
In practice: An order-tracking service scaled down heavily at night and showed eighty-millisecond responses in staging. One morning a campaign notification went out and thousands of users opened the app together. New pods started, but each loaded configuration, opened connections, and warmed caches on its first requests, sending traffic the cache would normally absorb straight to the database. Latency jumped from milliseconds to seconds, retries climbed, and the system read as available while feeling broken. The root cause was an untested cold path.
The goal is not to eliminate every cold start. It is to make cold starts bounded, predictable, and safe, because systems do not only run. They wake, recover, scale, and restart.
5. The Cost of Context Switching in Concurrency: Why More Threads Can Mean Less Throughput
Concurrency looks like a simple fix. If one thread is slow, add more. If requests pile up, run more in parallel. But every concurrent system pays a hidden tax, and at scale that tax can turn parallelism into pure overhead.
A context switch is the work the CPU does to pause one execution unit and resume another, saving registers, program counter, and stack pointer, then loading the next thread's state. It is what lets many threads share a core, and it is unavoidable. The trouble starts when runnable tasks vastly outnumber cores. Give a machine with eight cores five hundred active threads and only eight run at any instant while the scheduler churns through the rest. Each switch has a direct cost, but the larger cost is indirect: CPU caches lose their locality, locks grow contended, and tail latency rises as requests wait to be scheduled.
The remedy is matching concurrency to the shape of the work:
- CPU-bound work should run with a degree of parallelism close to the core count.
- I/O-bound work tolerates more concurrency, but unbounded threads are still dangerous.
- Bounded thread pools, event loops, async I/O, back-pressure, and structured concurrency keep useful work high and wasted switches low.
Failure pattern: A notification service spawned a fresh thread per message for validation, rendering, preference lookup, and delivery. It passed testing comfortably. Under campaign load, CPU hit ninety percent while throughput barely moved, latency spiked, and retries flooded downstream services. Scaling instances out raised cost without fixing anything, because the real cause was thread explosion and the context-switch overhead it created. Bounded worker pools, batching, and async I/O cut the CPU pressure and made throughput predictable.
Concurrency is not about creating more threads. It is about creating the right amount of parallel work for the system to handle, with respect for cores, workload type, scheduling cost, and downstream limits.
The Common Thread: Behaviour Under Load Is Chosen, Not Discovered
These five patterns reinforce one another. Circuit breakers and rate limiters decide how the system behaves when a dependency fails. Scaling choices decide where capacity comes from and what it costs in complexity. Hotspot defences determine whether additional machines actually share the workload. Cold-start design determines whether the system is usable the moment it wakes. Concurrency limits decide whether the CPU spends its time working or switching.
The thread running through all of them is intentionality: deciding what the system should do under stress, rather than learning it during an outage. Strong performance engineering is mostly this, choosing behaviour in advance. Pick one section and trace it through the most fragile path in your system this week. Acting on these patterns early always costs less than acting on them under pressure.
Performance and Scaling FAQ
1. When should I use a circuit breaker versus a rate limiter? Use both, because they protect different things. A rate limiter sits at the entrance and caps the amount of traffic admitted, defending against spikes and abusive clients. A circuit breaker sits in front of a dependency and stops calls to it once its failure rate crosses a threshold, defending downstream services and your own thread pools. Together, they enable graceful degradation rather than a cascading failure.
2. Is horizontal scaling always better than vertical scaling? No. Vertical scaling is simpler, keeps strong consistency easy, and is often the right first move for stateful databases. Horizontal scaling gives elasticity and fault tolerance but makes sharding, partition keys, and replication lag part of your core design. The deciding factor is whether the bottlenecked tier can actually distribute its work cleanly.
3. Why does adding more nodes not fix a hotspot? Because a hotspot is a distribution problem, not a capacity problem. If most traffic targets a single partition due to a poor partition key or a popularity spike, extra nodes remain idle while the hot shard remains saturated. The fix is better key design, hash-based partitioning, key salting, or shard splitting, not more machines.
4. How do I reduce cold start latency? Keep boot paths lean, preload only what readiness requires, reuse connections, and separate liveness from readiness so traffic arrives only when a node can serve it. For latency-critical services, keep a minimum running capacity or use provisioned concurrency rather than scaling to zero, and measure time-to-first-successful-request, not just warm latency.
5. Can too much concurrency slow a system down? Yes. When runnable threads far outnumber CPU cores, the scheduler spends increasing time on context switches, cache locality degrades, and tail latency rises even though the system looks busy. Bounded thread pools, async I/O, and back-pressure usually deliver higher, more predictable throughput than an unbounded thread-per-task model.
Learn more about Tarento's Performance Engineering | Cloud & DevOps Services


How Do You Design UX for AI, Automation, and Intelligent Platforms?


