How a Global Specialty Chemicals Manufacturer Unified SAP and Plant-Floor Data for Manufacturing Intelligence
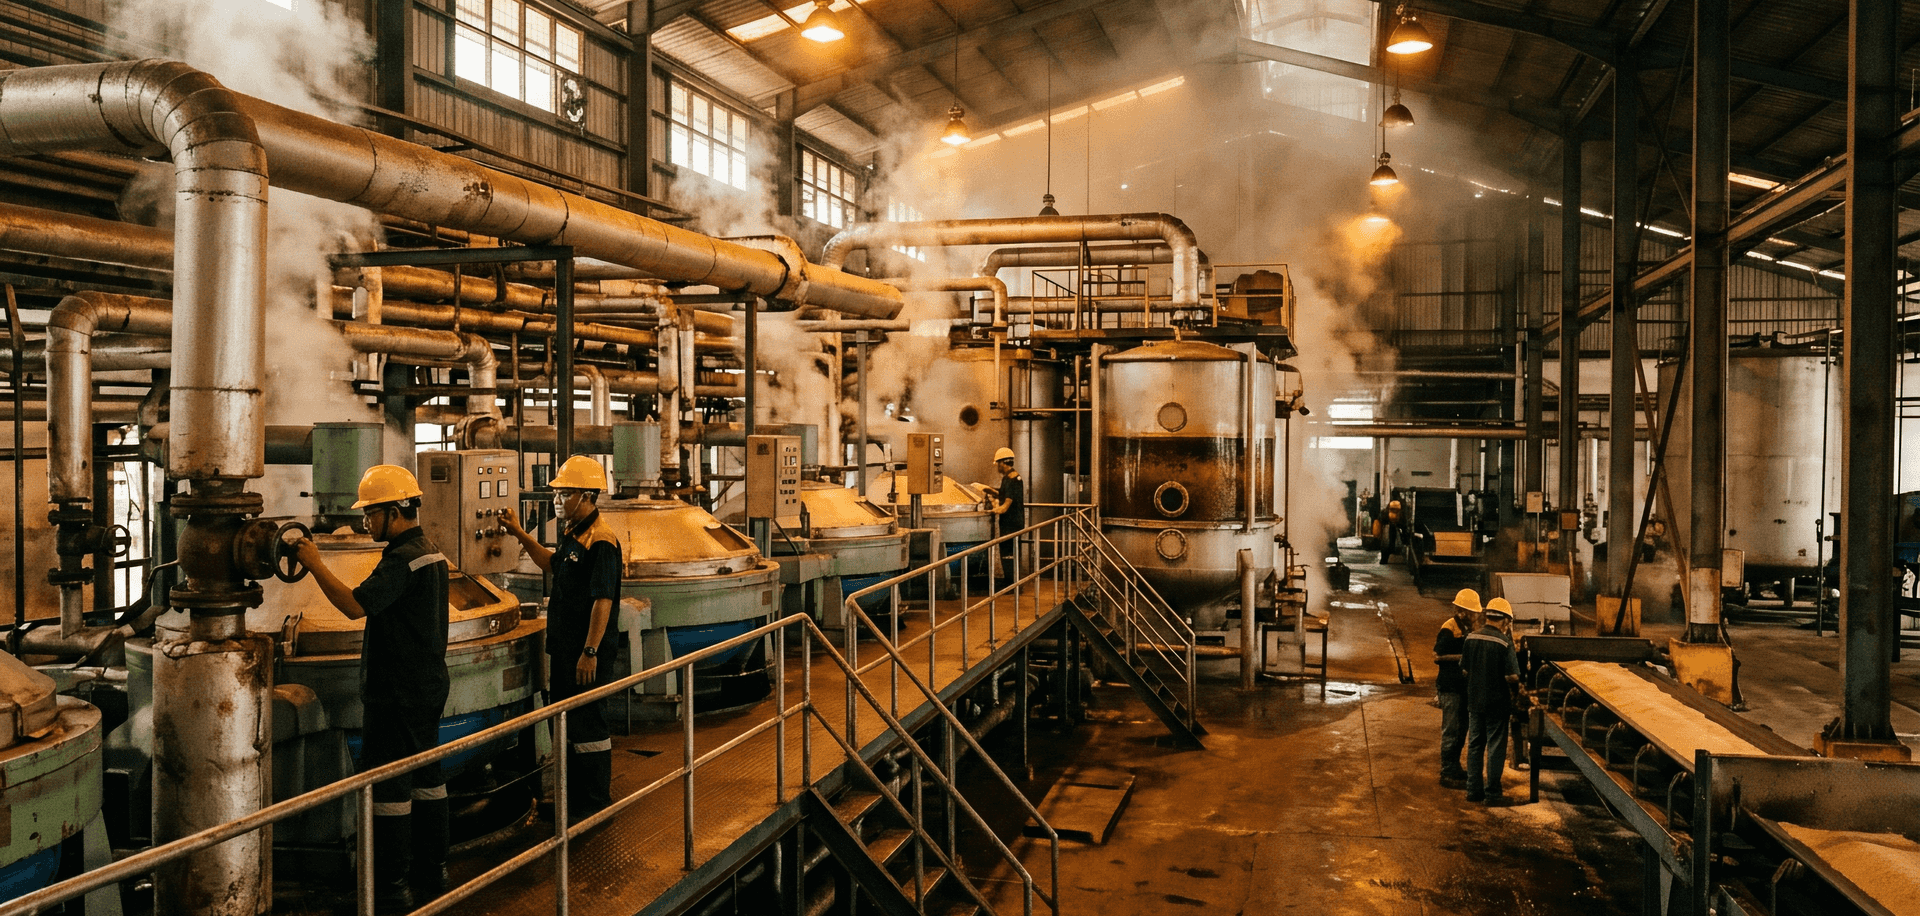
Manufacturing data contextualization becomes essential when connecting ERP and plant-floor systems is no longer enough to produce reliable answers. SAP may hold material batch and quality records, while plant historians capture reactor events, blend ratios and energy consumption. Bringing these datasets together does not automatically establish which records correspond or whether KPIs mean the same thing across plants.
A global specialty chemicals manufacturer engaged Tarento to replace fragmented Excel reporting with a standardized manufacturing data platform spanning 6+ production plants. Tarento delivered SAP reporting modernization, OT-to-cloud integration and a live root-cause analysis pipeline. The implementation also revealed a deeper challenge: integrated records did not always produce defensible answers to cross-system manufacturing questions.
This case study explains the delivered platform, the unresolved identity and business-logic gaps, and Tarento's proposed Semantic Bridge approach for governing manufacturing data relationships and KPI definitions.
At a glance
- Client: A global specialty chemicals manufacturer
- Footprint: 6+ production plants, global operations
- Challenge: Fragmented regional Excel reporting hid inconsistent KPI definitions. Once the data was integrated, records from SAP and the plant floor were connected but not reliably correlated.
- Delivered: A standardized enterprise reporting layer, plant-to-cloud OT integration across 6+ plants, and a live AI-driven root-cause analysis and exception reporting engine
- Proposed next phase: The Semantic Bridge, a governed layer that defines how SAP and plant-floor records relate and how every energy and quality KPI is calculated
- Technology: SAP ECC, SAP BW, Azure Databricks, Azure Data Factory, Azure SQL Database, Power BI, Power Apps, an industrial historian and an MQTT streaming layer
SAP and Plant Historian Integration Across 6+ Manufacturing Plants
Tarento delivered the manufacturing intelligence platform in three workstreams.
1. Enterprise reporting layer. A standardized enterprise data warehouse on Databricks and Azure SQL Database, sourced from SAP ECC and BW. It replaced manual regional Excel reporting with weekly and monthly Power BI reports, secured at the dataset level by role.
2. OT and historian integration. A plant-to-cloud pipeline carries data from plant historian servers through a plant-side MQTT broker and a secured channel into a cloud streaming layer. From there, Azure Data Factory loads it into a Bronze, Silver and Gold (medallion) lakehouse, consumed through Power BI and Power Apps.
3. AI-driven root-cause analysis and exception reporting. A live analytics pipeline runs from the historian at 6+ plants into a Python analytics engine. The engine runs sensor sanity checks, KPI deviation analysis and domain-knowledge root-cause analysis, with results shown in Power BI.
Results delivered:
- Automated report extraction from SAP ECC and BW removed manual, error-prone regional reporting. The client now has one standardized source of manufacturing KPIs, with drill-down from global to plant level.
- A reusable SAP ingestion framework, designed from the start to extend to other reporting needs.
- SAP master, quality and transactional data reconciled with real-time historian data, two very different kinds of data in one view.
- A production OT-to-cloud pipeline running across 6+ plants, feeding the live root-cause analysis engine.
- Element-by-element data mapping across 19+ manufacturing and energy data points, with data quality gaps documented openly instead of absorbed into the pipelines.
Why Connected Manufacturing Data Still Produced Unreliable Answers
In workshops with plant operations, quality and process engineering leads, four practical questions kept coming up.
- Which reactors ran blend ratios out of spec, and which SAP-certified raw-material batch fed them? Blend ratio is a live historian calculation. Raw-material quality sits in SAP against a batch. Nothing defined which reactor charge on the floor matched which SAP batch document, especially once batches were blended.
- Which plant's fuel mix should count toward this quarter's energy benchmark: SAP's classification or the plant's own spreadsheet? Fuel-source classification came from SAP at some plants and from local, unstructured spreadsheets at others. No rule said which source wins when they disagree.
- For a quality deviation flagged by root-cause analysis, which raw-material record applies: the SAP record or the supplier's Certificate of Analysis? Raw-material quality data came from both. No precedence rule existed for when they disagree.
- Is one plant's energy-per-unit-of-production figure comparable to another's? Each plant's process team submitted the KPI as-is, before central standardization. Comparing them assumed the formula was the same everywhere, and nobody had checked.
Two of the four questions returned nothing, which is unhelpful but safe. The other two returned a number nobody had chosen to defend. The platform picked whichever source table looked closest to the term and gave no sign that a choice had been made.
Two Manufacturing Data Contextualization Gaps: Identity and Logic
Every unanswered question falls into one of two gaps. They need different work.
The identity gap asks whether this SAP material batch is the same as this reactor charge in the historian. Both records exist, but nothing states the match. It's harder than a lookup table, because one material lot can be split across several reactor charges, and one charge can draw from several lots blended together. Any correlation that assumes one batch equals one reactor charge is wrong wherever blending happens.
The logic gap asks what a term means and which source is authoritative. Here it covers fuel-source classification, raw-material quality precedence, blend ratio inputs and the energy-per-unit benchmark. This gap is specific to each client, and closing it creates more value. An engineer who calculates the energy benchmark straight from historian and SAP tables gets a number in the right order of magnitude. That number differs from the plant next door's, even though everyone assumed the term meant the same thing.
Proposed Semantic Bridge: Governing Data Relationships and KPIs
The Semantic Bridge is a governed, versioned layer between the data platform and everything that reads it. It has five parts:
- Entity Registry. Canonical entities for plant, reactor, line, material batch and energy meter, each with one key and a named owner.
- Identity Crosswalk. Maps each SAP batch document to the matching historian reactor-charge records. Each mapping is labeled with the role the batch played and a confidence level, and versioned over time. It handles one-to-many and many-to-one relationships, so blended charges resolve correctly.
- Logic Registry. Defines every energy, quality and blend KPI as tested SQL, with its grain, filters, provenance, owner and effective date.
- Reconciliation test harness. Every KPI must match the client's previously reconciled regional report before it is published. If it doesn't tie out, it doesn't go live.
- Catalog publisher. Writes the results into the existing Databricks catalog as constraints, comments, certified views, metric views and glossary entries.
The design rule: No dashboard, report or AI tool queries the bridge directly. The bridge writes only into the catalog, so Power BI dashboards, the root-cause analysis engine and future natural-language or agentic interfaces all read the same governed definitions from the same place.
The Bridge adds no new platform. The registries are tables in the client's catalog, the jobs run in its existing workspace and the tests are SQL. It needs no network access out of the plant beyond what the existing pipeline already uses.
How SAP Material Batches Relate to Historian Reactor Charges
Take the challenge the platform build had already flagged: matching a raw-material batch to the reactor charge and blend ratio it fed.
Without the Bridge, an analyst matches records by the closest timestamp and assumes one batch per charge. That works for single-source charges. Wherever blending happened, it's silently wrong, with no flag and no caveat.
With the Bridge, the correlation is a registered Logic Registry entry:
| Field | Definition |
|---|---|
| Grain | Reactor charge × material batch × time window |
| Inputs | SAP batch document (quantity, Certificate of Analysis reference, quality attributes) and the historian reactor-charge log (feed timestamps, recorded blend ratio) |
| Rule | A reactor charge may draw from more than one material batch, so the correlation must handle one-to-many and many-to-one, not a simple key match |
| Owner | Plant Quality Lead |
| Provenance | The platform's original element-by-element data mapping exercise |
| Test | The recalculated blend ratio must match the plant's manually reconciled monthly quality report, batch by batch |
The correlation resolves multi-batch blending explicitly. It ties each record to the correct reactor and line, and it isn't trusted until it matches the plant's own reconciled report.
Why the data mapping is the right place to start
To correlate SAP and historian data at all, the platform team had to map 19+ manufacturing and energy data points, element by element. That work showed where each source was authoritative:
- 3 sourcing categories where SAP was identified as the authoritative source
- 1 explicit governance gap, fuel-source classification, where neither source was authoritative
What the Semantic Bridge is designed to close
These are the outcomes the proposed next phase is designed to achieve:
- One fuel-source definition. The SAP vs spreadsheet inconsistency becomes one governed sourcing rule, logged in the registry instead of decided plant by plant.
- A declared quality precedence rule. When the SAP record and the supplier's Certificate of Analysis disagree, a registered rule with a named owner decides which applies.
- Tested batch-to-reactor correlation. Raw-material batches resolve to the correct reactor charge, including blended charges, instead of being assumed one-to-one.
- One definition per KPI. Every energy and quality KPI has one tested definition, an owner and provenance, so energy per unit of production means the same thing in every plant's report.
- Root-cause analysis that cites its inputs. A flagged deviation traces back to a named source table, join rule and owner.
Why the approach holds up
- It treats the problem as a business-definition issue, not only a data integration issue.
- It handles the identity gap and the logic gap separately, because they need different rules and different owners.
- It builds on work already done. The data mapping becomes governed, reusable definitions instead of disappearing into pipeline code.
- Nothing publishes until it reconciles. Every KPI must match the client's own reconciled reports first.
- It adds to the existing platform instead of creating another system to maintain.
The approach is designed to reuse common SAP manufacturing concepts, such as material and batch master data, alongside customer-specific plant, equipment and quality models. The underlying governance pattern is reusable, while the precise entity relationships, source authority rules and KPI calculations must be validated for each manufacturing environment.
The proposed next step: A six-week proof of value
Tarento proposed a six-week proof of value, designed so it can fail:
- Pick three questions that plant, quality or energy leads already ask and the current stack answers badly.
- Recover the correlation logic, at field level, for the SAP and OT elements those questions need.
- Seed a registry slice with entities, keys, metrics and tests, published into the existing catalog. It's additive and reversible.
- Test against the client's own reports. Correlations are promoted only when they match the manually reconciled plant reports.
- Score it honestly, comparing correlation accuracy and provenance before and after, including what didn't work.
The stop condition: If the difference isn't obvious after six weeks, Tarento says so and stops.
Already unifying SAP and plant-floor data on Databricks?
Bringing SAP and plant-floor data into Databricks solves the connectivity problem. It doesn't define how records from different systems relate, or how shared KPIs should be calculated. If your platform holds the data but your teams still can't defend cross-plant answers, start with three questions and six weeks.
Explore how manufacturing data contextualization can improve batch traceability, data governance and cross-plant analytics. Connect with Tarento's experts to discuss your challenges and a focused proof of value.
By submitting this form, you agree to Tarento processing your data as described in our Privacy Policy.


Legacy Application Modernization and IFS ERP Integration: How a Global Supply Chain Company Rebuilt Its Recycling Order Processing System